Microsoft has released the latest version of PerfView, that fixes minor bugs and adds support for Microsoft .NET 4.5. Microsoft has developed this tools for analysing and isolating CPU or Memory related performance issues for application developers. It will help you narrow down the function or thread, which is causing the performance problem and point to the source code, so that you can optimize it or fix any bugs in that specific section.
PerfView
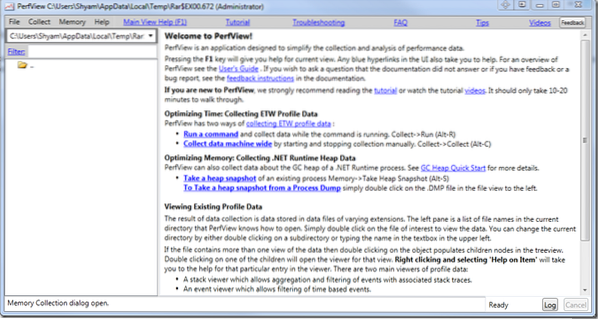
Unlike some other tools, I have found PerfView from Microsoft, to be very user-friendly with tons of hyperlinked information for the user, to understand how it works. Microsoft has included a Tutorial.exe file; try it and see how it works. The tool uses Event Tracing for Windows (ETW) feature to analyse and dump the data. It's very helpful while troubleshooting performance related problems for your program.
The tool basically takes snapshot of the stacks, by interrupting the CPU. It is highly recommend to read the Tutorial section and the guides provided within the tool, to understand the tool better.
By default, it takes the stack of all the processes - but you can choose the EXE file that you wand to troubleshoot. As you can see in the image below, it you tells you the name of each frame in the stack collection, with the total cost of the CPU and total amount of the cost.
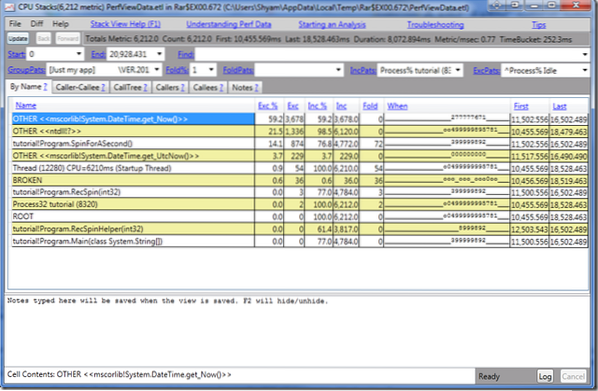
This way, the troubleshooting is a lot easier, and it helps you find out, which frame in the stack could be causing the CPU usage problems and pin-point the source of it. You can also define the Symbol server, so that it downloads it and caches it locally.
It is a great tool for application developers to narrow down and pin-point performance related problems, more effectively. If you're a application developer, be sure to check out PerVeiw; it will certainly help you.
PerfView Tutorials
For more information here are a couple of video tutorials available about Time investigation:
- Collecting Data with the PerfView 'Run' Command
- A Simple CPU Investigation
- Symbol Resolution
- Grouping And Folding
- Drilling Into Cost
PerfView Download
You can download it from here.