With its own stack of schedulers and controllers, Kubernetes can recover from minor failures, nodes failing or apps crashing from inside their pods. However, if a lot of crashes happen it may have nothing to do with the infrastructure but everything to do with your app which Kubernetes may try to restart over and over, but since the code is at fault the fault will persist and may even go unnoticed.
The kind of bugs that go unnoticed most of the times are the ones where apps don't crash but end up over utilizing system resources and hurting the clusters over all performance. These are the especially nasty cases and Kubernetes Metrics Server can be a useful tool in keeping an eye on them.
The project is officially a part of Kubernetes project but doesn't come pre-enabled in most Kubernetes-certified distros. It has two important parts worth discussing the Metrics API and the Metrics Server itself. But first let's provision it onto our Kubernetes (K8) cluster.
An Experimental Kubernetes Setup
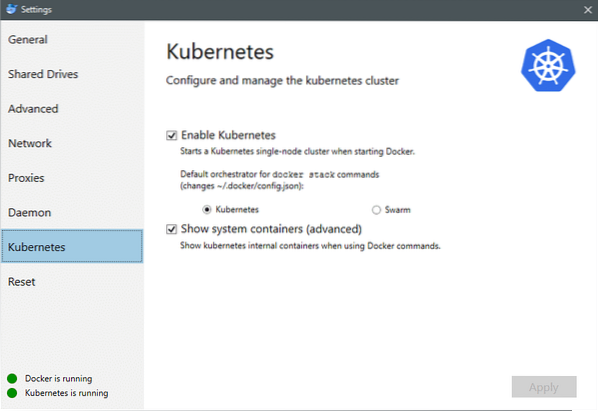
As of July 2018, Docker for Mac and Windows both come with a Kubernetes certified implementation of K8 itself. Making it as easy as installing K8 on a Linux distro. You can go to Docker Settings and if the Docker instance is up-to-date you will find a Kubernetes tab in the menu. Just enable Kubernetes instead of Docker Swarm and you will have a single node cluster up and running ready for experimentations.
Next, we need some simple set of applications up and running for our use case. Create a folder called Deployments and inside it let's create a nginx-deployment.yaml files which would deploy stateless Nginx pods.
apiVersion: apps/v1 # for versions before 1.9.0 use apps/v1beta2kind: Deployment
metadata:
name: nginx-deployment
spec:
selector:
matchLabels:
app: nginx
replicas: 2 # tells deployment to run 2 pods matching the template
template:
metadata:
labels:
app: nginx
spec:
containers:
- name: nginx
image: nginx:1.7.9
ports:
- containerPort: 80
Save the file and in the same directory where this file is, run the command:
$ kubectl create -f nginx-deployment.yamlWe might have to wait a few minutes to let Kubernetes download the container images, provision the containers and do a bit of miscellaneous bookkeeping. Once that is done you can see the list of pods as:
$ kubectl get pods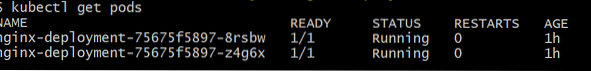
As you can see we have two instances of the pod, as the .yaml file had prescribed.
Now that we have something to monitor we need to enable Metrics Server. First, check the version of Kubernetes that you are running. If the version is 1.8 or above then we would run a different deployment and if it is 1.7 then we resort back to the legacy one :
$ kubectl versionYou can get the official image and get started by cloning this GitHub repo and then inside the repository's root run the kubectl create -f with the appropriate .yaml depending on the K8 version that you are running.
$ git clone https://github.com/kubernetes-incubator/metrics-server.git$ cd metrics-server
# If you are running Kubernetes version 1.8 or higher
$ kubectl create -f deploy/1.8+/
# If the version is 1.7, then
$ kubectl create -f deploy/1.7/
Give the kubernetes a while to download the images and spin up the metrics server. It might take a few minutes. Once that is done, you are now ready to run the metrics server. The basic command is inspired from the top command that is often run to monitor a Linux system. But it has two variants one for check the resource utilizations on the compute nodes and second to gauge the resource consumed by the deployed pods and the. Here's how to see those two details:
$ kubectl top node$ kubectl top pod
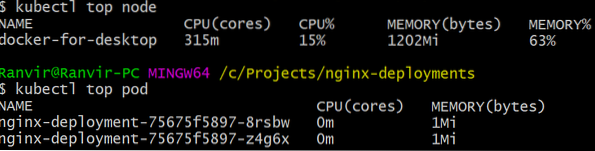
You can see how much a pod is taxing your system in terms of memory or CPU time and using the Metrics API you can set up alerts according, as well.
Where will it go from here?
The emerging use cases from the metrics server are going to be crucial in the future of Kubernetes. This project is still in version 0.2.x, once it matures and gets integrated into the mainstream Kubernetes architecture it will collect important data for the scheduler, helping it efficiently allocate pods to nodes in a much more efficient manner.
Similarly, Horizontal Pod Autoscaler will greatly benefit from the project and will help you scale up or scale down so that the resources are used optimally by the applications.
References
- Nginx Deployments
- Kubernetes Metrics Server
- Design Docs for the Metrics API can found here and similar you can find information about the Metrics Server here.