Use of Django Debug Toolbar:
It is a very useful debugging tool that provides different types of information with the error pages. It inserts a sidebar to render HTML requests that include various types of information like the version of Python, Django, and toolbar, timing information, view information, execution time information of SQL queries, etc. It is not installed with the Django framework by default. Run the following command to install the Django Debug Toolbar.
$ pip3 install django-debug-toolbarPrerequisites:
Before practicing the script of this tutorial, you must complete the following tasks.
- Install the Django version 3+ on Ubuntu 20+ (preferably)
- Create a Django project
- Run the Django server to check the server is working properly or not.
Setup a Django App with Django Toolbar Option:
A. Run the following command to create a Django app named debugapp.
$ python3 manage.py startapp debugappB. Run the following command to create the user for accessing the Django database. If you have created the user before then you don't need to run the command.
$ python3 manage.py createsuperuserC. Add the app name in the INSTALLED_APP part of the settings.py file.
INSTALLED_APPS = […
'debugapp',
'debug_toolbar'
]
D. Add the middleware entry for the debug toolbar in the MIDDLEWARE part of settings.py.
MIDDLEWARE = […
'debug_toolbar.middleware.DebugToolbarMiddleware',
]
E. Create a folder named templates inside the debugapp folder and set the template's location of the app in the TEMPLATES part of the settings.py file.
TEMPLATES =[
… .
'DIRS': ['/home/fahmida/django_pro/validationapp/templates'],
… .
,
]
F. Add the following lines at the end of the settings.py file to display the Django toolbar.
INTERNAL_IPS = ['127.0.0.1'
]
Create Necessary Files for the App:
You can check the Django toolbar option in any existing Django app or by creating new files for a new Django app. A new Django app named debugapp was created in the previous part of this tutorial. A simple HTML file is created in this part of this tutorial that will display the base URL when the Django server starts.
Create an HTML file named index.html with the following script that will show a simple heading text.
index.html
Using Django Toolbar
Modify the views.py file with the following script to render the index.html file in the browser.
views.py
# Import render modulefrom django.shortcuts import render
# Add index function to load html file
def index(request):
return render(request, 'index.html')
Modify the urls.py file of the Django project with the following script. Two paths had been defined at the beginning of the script to display the Django Administration Dashboard and the content of index.html. Next, another path had been defined for displaying the debug toolbar if the DEBUG is set to True in the settings.py.
urls.py
# Import settingsfrom django.conf import settings
# Import include and path
from django.urls import include, path
# Import admin module
from django.contrib import admin
# Import view
from debugapp import views
# Define the paths for the app
urlpatterns = [
path('admin/', admin.site.urls),
path(", views.index),
]
# Add Django Debug Toolbar
if settings.DEBUG:
import debug_toolbar
urlpatterns +=[
path('__debug__/', include(debug_toolbar.urls)),
]
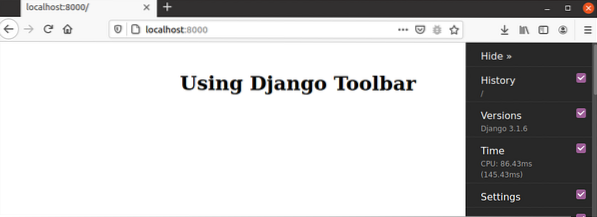
Now, run the Django server and execute the following URL from the browser.
http://localhost:8000
If the Django toolbar was installed and configured properly then the debug toolbar option will appear on the right side of the browser like the following image.
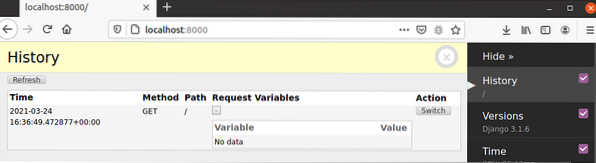
If the user clicks on the History option, then the history information of the current page will be displayed like the following image. The execution time, request method, path, request variables, and the button for the action will be displayed.
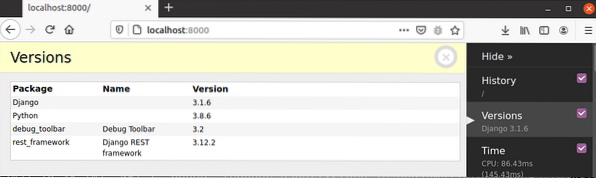
If the user clicks on the Versions option the version information of Django, Python, and other installed modules will be displayed. The following output shows the version information of Django, Python, debug_toolbar, and Django REST Framework.
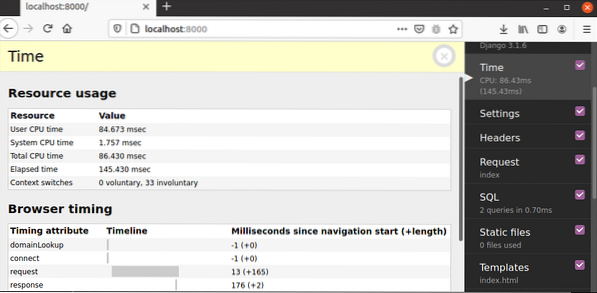
If the user clicks on the Time option, then the information about the usage time of different types of resources including the browser will be displayed.
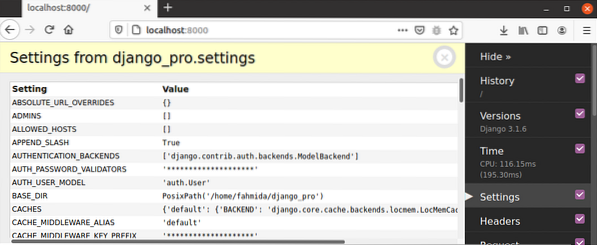
If the user clicks on the Settings option, then all the information from the settings.py file will be displayed.
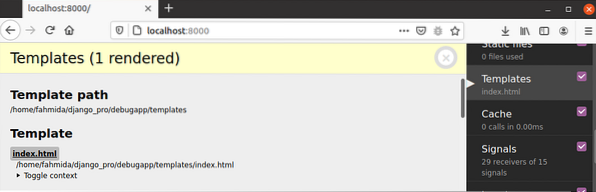
If the user clicks on the Templates option, then the information of the template location of the executing app and the path of the current template page will be displayed.
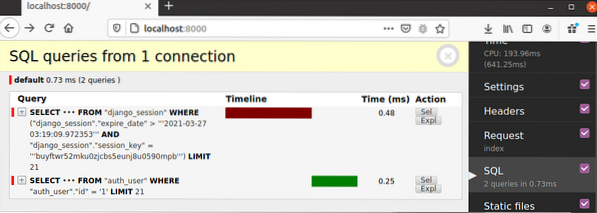
If the user clicks on the SQL option, then the SQL queries information will be displayed, as shown in the output.
Conclusion:
The Django debug toolbar has many options for examining the Django app and plays a major role in finding out errors very easily. How this toolbar can be installed, configured, and some common options of this toolbar were explained in this tutorial to help the Django developer for debugging the Django application. After completing the application development, the debug mode must be turned off at the time of deploying the application.