- What is Pandas Package
- Installation and getting started
- Loading data from CSVs into Pandas DataFrame
- What is DataFrame and how does it work
- Slicing DataFrames
- Mathematical operations over DataFrame
This looks like a lot to cover. Let us get started now.
What is Python Pandas package?
According to the Pandas homepage: pandas is an open source, BSD-licensed library providing high-performance, easy-to-use data structures and data analysis tools for the Python programming language.
One of the coolest things about Pandas is that it makes reading data from common data formats like CSV, SQL etc. very easy which makes it equally usable in production grade applications or just some demo applications.
Install Python Pandas
Just a note before starting the installation process, we use a virtual environment for this lesson which we made with the following command:
python -m virtualenv pandassource pandas/bin/activate
Once the virtual environment is active, we can install pandas library within the virtual env so that examples we create next can be executed:
pip install pandasOr, we can use Conda to install this package with the following command:
conda install pandasWe see something like this when we execute the above command:
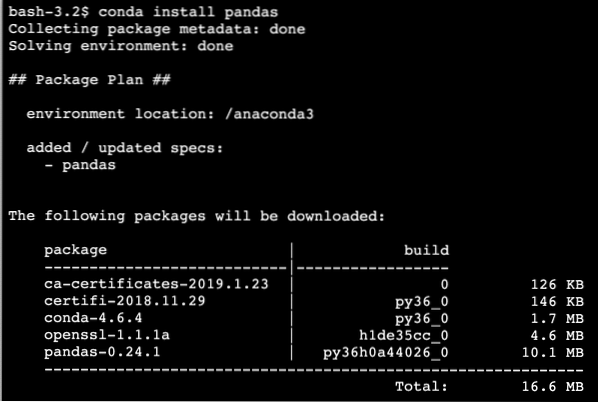
Once the installation completes with Conda, we will be able to use the package in our Python scripts as:
import pandas as pdLet's start using Pandas in our scripts now.
Reading CSV file with Pandas DataFrames
Reading a CSV file is easy with Pandas. For demonstration, we have constructed a small CSV file with following contents:
Name,RollNo,Date Of Admission,Emergency ContactShubham,1,20-05-2012,9988776655
Gagan,2,20-05-2009,8364517829
Oshima,3,20-05-2003,5454223344
Vyom,4,20-05-2009,1223344556
Ankur,5,20-05-1999,9988776655
Vinod,6,20-05-1999,9988776655
Vipin,7,20-05-2002,9988776655
Ronak,8,20-05-2007,1223344556
DJ,9,20-05-2014,9988776655
VJ,10,20-05-2015,9988776655
Save this file in the same directory as of the Python script. Once the file is present, add the following code snippet in a Python file:
import pandas as pdstudents = pd.read_csv("students.csv")
students.head()
Once we run the above code snippet, we will see the following output:
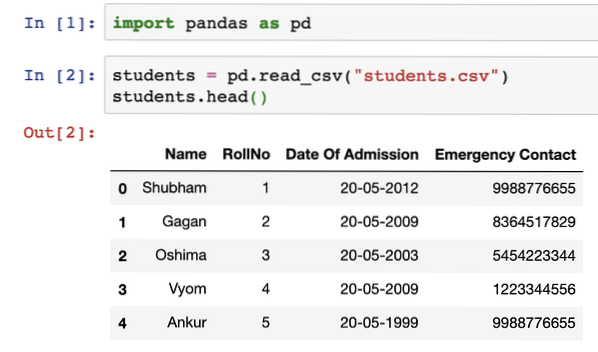
The head() function in Pandas can be used to show a sample of data present in the DataFrame. Wait, DataFrame? We will study much more about DataFrame in the next section but just understand that a DataFrame is a n-dimensional data structure which can be used to hold and analyse or complex operations over a set of data.
We can also see how many rows and columns does the current data have:
students.shapeOnce we run the above code snippet, we will see the following output:
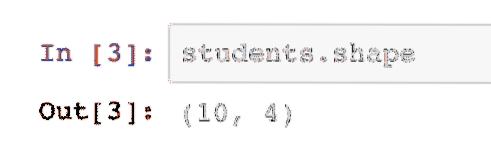
Note that Pandas also count the number of rows starting from 0.
It is possible to get just column in a list with Pandas. This can be done with the help of indexing in Pandas. Let's look at a short code snippet for the same:
student_names = students['Name']student_names
Once we run the above code snippet, we will see the following output:
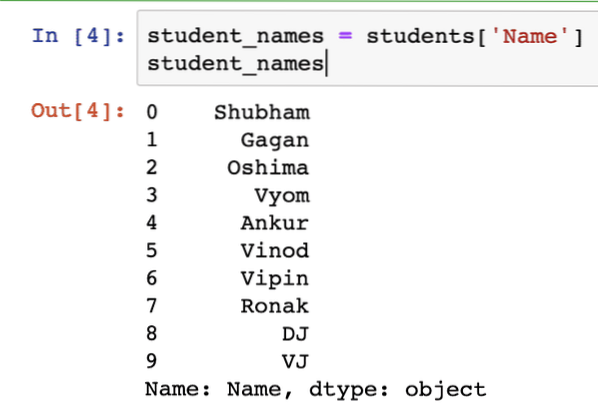
But that doesn't look like a list, does it? Well, we need to explicitly call a function to convert this object into a list:
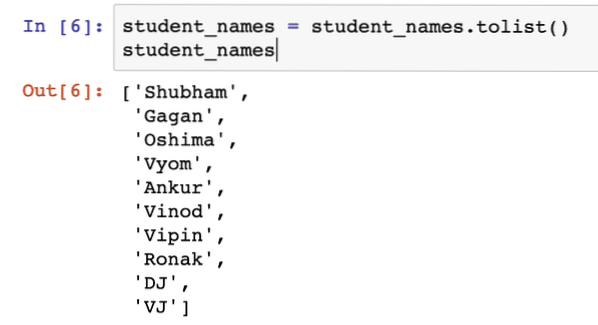
student_names = student_names.tolist()student_names
Once we run the above code snippet, we will see the following output:
Just for extra information, we can make sure that each element in the list is unique and we only pick non-empty elements by adding some simple checks like:
student_names = students['Name'].dropna().unique().tolist()In our case, the output won't change as the list already doesn't contain any foul values.
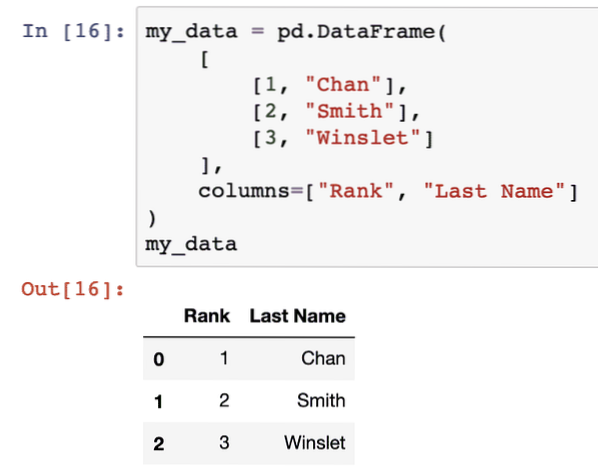
We can also make a DataFrame with raw data and pass the column names along with it, like shown in the following code snippet:
my_data = pd.DataFrame([
[1, "Chan"],
[2, "Smith"],
[3, "Winslet"]
],
columns=["Rank", "Last Name"]
)
my_data
Once we run the above code snippet, we will see the following output:
Slicing DataFrames
Breaking down DataFrames to extract only the selected rows and columns is an important functionality to keep attention towards required parts of data which we need to use. For this, Pandas allows us to slice DataFrame as and when needed with statements like:
- iloc[:4,:] - selects the first 4 rows, and all of the columns for those rows.
- iloc[:,:] - the complete DataFrame is selected
- iloc[5:,5:] - rows from position 5 onwards, and columns from position 5 onwards.
- iloc[:,0] - the first column, and all of the rows for the column.
- iloc[9,:] - the 10th row, and all of the columns for that row.
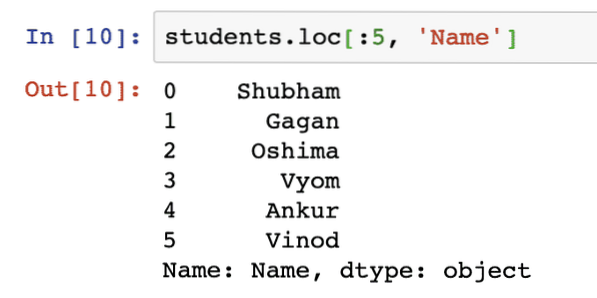
In the previous section, we have already seen indexing and slicing with column names instead of the indexes. It is also possible to mix slicing with index numbers and column names. Let's look at a simple code snippet:
students.loc[:5, 'Name']Once we run the above code snippet, we will see the following output:
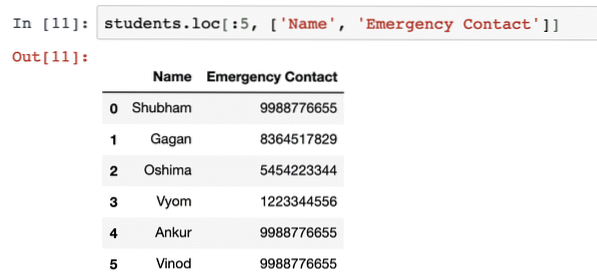
It is possible to specify more than one column:
students.loc[:5, ['Name', 'Emergency Contact']]Once we run the above code snippet, we will see the following output:
Series Data Structure in Pandas
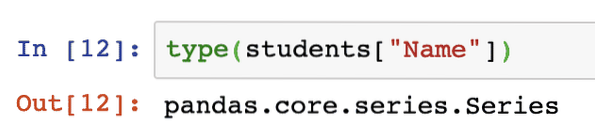
Just like Pandas (which is a multi-dimensional data structure), a Series is a one-dimension data structure in Pandas. When we retrieve a single column from a DataFrame, we are actually working with a Series:
type(students["Name"])Once we run the above code snippet, we will see the following output:
We can construct our own Series as well, here is a code snippet for the same:
series = pd.Series([ 'Shubham', 3.7 ])series
Once we run the above code snippet, we will see the following output:
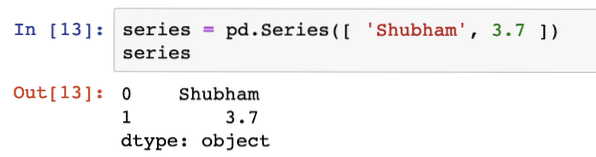
As clear from the example above, a Series can contain multiple data types for the same column as well.
Boolean filters in Pandas DataFrame
One of the good thing in Pandas is how it is to extract data from a DataFrame based on a condition. Like extracting students only when there roll number is greater than 6:
roll_filter = students['RollNo'] > 6roll_filter
Once we run the above code snippet, we will see the following output:
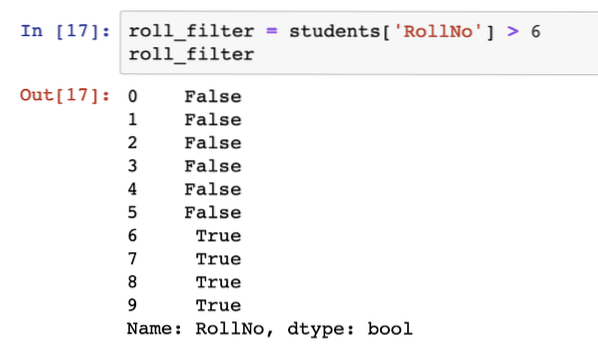
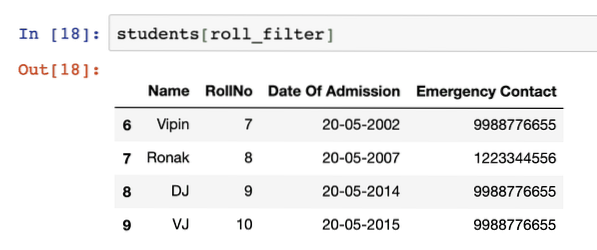
Well, that's not what we expected. Although the output is quite explicit about which rows did satisfy the filter we provided but we still don't have the exact rows which satisfied that filter. Turns out that we can use filters as DataFrame indexes as well:
students[roll_filter]Once we run the above code snippet, we will see the following output:
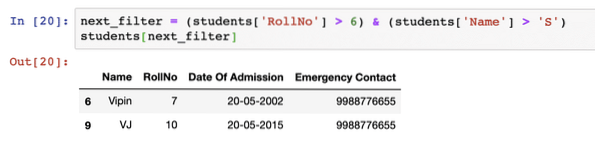
It is possible to use multiple conditions in a filter so that the data can be filtered on one concise filter, like:
next_filter = (students['RollNo'] > 6) & (students['Name'] > 'S')students[next_filter]
Once we run the above code snippet, we will see the following output:
Calculating Median
In a DataFrame, we can compute many mathematical functions as well. We will give a good example of calculating median. The median will be calculated for a date, not for just numbers. Let's look at a short code snippet for the same:
dates = students['Date Of Admission'].astype('datetime64[ns]').quantile(.5)dates
Once we run the above code snippet, we will see the following output:
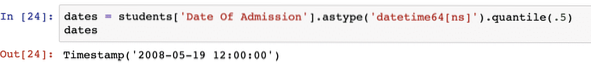
We achieved this by first indexing the date column we have and then providing a data type to the column so that Pandas can infer it correctly when applies the quantile function to calculate the median date.
Conclusion
In this lesson, we looked at various aspects of Pandas processing library which we can use with Python to collect data from various sources into a DataFrame data structure which allows us to sophisticatedly operate on a dataset. It also allows us to get sub-set of data we want to work on momentarily and provides many mathematical operations.
Please share your feedback on the lesson on Twitter with @sbmaggarwal and @LinuxHint.