- Logstash: It is an Open Source tool which is used to collect, parse and store logs for an application or a system which can be used later for metrics of APIs, errors faced in a system and many more use-cases which are beyond the scope of this lesson
- Kibana: This is a dashboard interface on the web which is an excellent dashboard used to search and view the logs that Logstash has indexed into the Elasticsearch index
- Filebeat: This is installed on the client-server who want to send their logs to Logstash. Filebeat acts as a log shipping agent and communicates with Logstash.
Let us also visualise how things will work: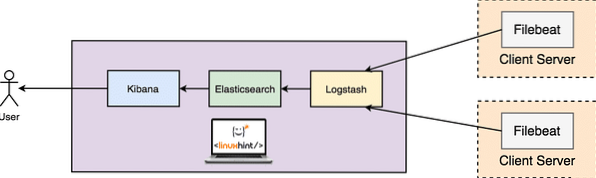
ELK Setup on Ubuntu
Prerequisites
For this lesson and all installations it needs, you should have root access to the machine. We will be using a machine with this configuration:
- Ubuntu 16.04
- RAM: 4 GB
- CPU: 2
Few application servers from where you want to gather data from would also be a good to have.
Install Java
To install Elasticsearch on Ubuntu, we must install Java first. Java might not be installed by default. We can verify it by using this command:
Checking Java version
java -versionHere is what we get back with this command: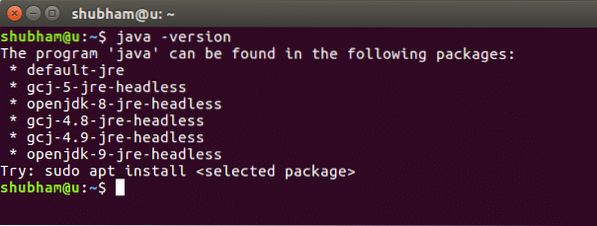
Checking Java version
We will now install Java on our system. Use this command to do so:
Installing Java
sudo add-apt-repository ppa:webupd8team/javasudo apt-get update
sudo apt-get install oracle-java8-installer
Once these commands are done running, we can again verify that Java is now installed by using the same version command.
Install Elasticsearch
Next step for the ELK Stack setup is installing Elasticsearch on Ubuntu Machine which will store the logs generated by systems and applications. Before we can install Elasticsearch, we need to import its public GPG keys to the rpm package manager:
GPG Keys
rpm --import http://packages.elastic.co/GPG-KEY-elasticsearchNow, insert the mentioned lines to the configuration file for the repository 'elasticsearch.repo':
Repository Config
name=Elasticsearch repository
baseurl=http://packages.elastic.co/elasticsearch/2.x/centos
gpgcheck=1
gpgkey=http://packages.elastic.co/GPG-KEY-elasticsearch
enabled=1
Now, read the lesson Install ElasticSearch on Ubuntu for installation process. Once ES is up and running, make sure it responds normally to this curl command:
ES Status
curl -X GET 'http://localhost:9200'The normal output will be: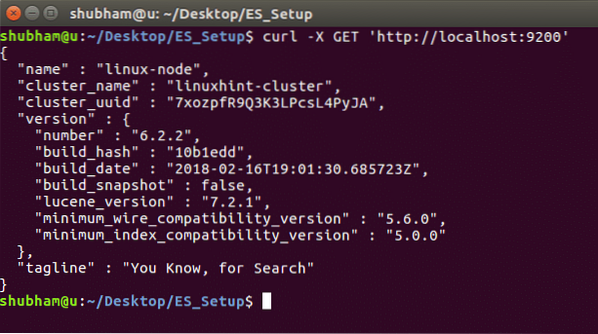
Install Logstash
Installing Logstash is very easy using the apt package manager and is available with the same repository and public key as Elasticsearch, so we don't have to do that again. Let's create the source list to start:
Create Source list
echo 'deb http://packages.elastic.co/logstash/2.2/debian stable main' | sudo tee /etc/apt/sources.list.d/logstash-2.2.x.listUpdate the apt package list:
Updating Packages
sudo apt-get updateInstall Logstash with a single command:
Install Logstash
sudo apt-get install logstashLogstash is installed but it is not configured yet. We will configure Logstash in coming sections.
Install Kibana
Kibana is very easy to install. We can start by creating the Kibana source list:
Create Kibana source list
echo "deb http://packages.elastic.co/kibana/4.5/debian stable main" | sudo tee -a /etc/apt/sources.list.d/kibana-4.5.x.listNow, we will update the apt package list:
Updating Packages
sudo apt-get updateWe are ready to install Kibana now:
Install Kibana
sudo apt-get -y install kibanaOnce Kibana is installed, we can run it:
Start Kibana Service
sudo update-rc.d kibana defaults 96 9sudo service kibana start
Before we show you the Kibana Dashboard, we need to setup the Filebeat Log shipping agent as well.
Setup Filebeat
We are ready to install Filebeat now:
Install Filebeat
sudo apt-get -y install filebeatBefore we can start the Filebeat service, we need to configure it for the input type and document type. Because we're using system logs only as of now, let's mention this in the configuration file in '/etc/filebeat/filebeat.yml':
Configure Filebeat
…input_type: log
document_type: syslog
…
We can also start filebeat now:
Start Filebeat Service
sudo update-rc.d kibana defaults 96 9sudo service filebeat start
Once filebeat is up and running, we can check that it is OK by issuing the following curl command:
Testing Filebeat
curl -XGET 'http://localhost:9200/filebeat-*/_search?pretty'We should receive a similar result as we got in the ES installation.
Connecting to Kibana
We are now ready to connect to Kibana. As we already started the Kibana service, its dashboard should be visible at:
Kibana Dashoboard URL
http://localhost:5601Once you're up on Kibana, create an index on Kibana with name 'filebeat-*'. Now based on the logs available, you can see the metrics and logs in your Kibana Dashboard:
Conclusion
In this lesson, we looked at how we can install and start using the ELK Stack for log visualisation and support an excellent Dashboard for business teams.