- Tracking the RAM consumption on an Ubuntu machine
- CPU Usage
- Disk Space consumption
- Process lifecycle
Though they can sound like minor issues but for servers with production apps, they really can create a big mess. In this post, we will create alerts so that whenever any of the above happens, stakeholders are alerted.
Getting Started
Now, everything starts with making an account. Visit DataDog and register for an account if you haven't already.
DataDog offers many services like:
- Monitors are the tools which help us to monitor an event which can be anything like how much RAM is free currently on the machine or how much disk space is free.
- Trace can be used to track how much it took to process a particular web request
- Post alerts to a tool you integrate like Slack or just post the message on an AMQP queue to track it everywhere
Much more can be done but we will have to limit ourselves and start giving practical examples.
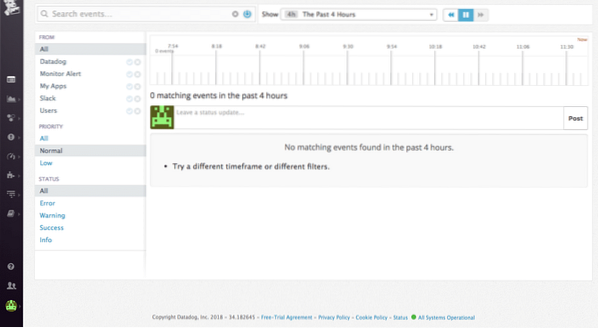
When we enter the DataDog, we can see homepage as:
Installing DataDog on Ubuntu
Installing DataDog on Ubuntu is very easy and uses just one command actually, which is:
DD_API_KEY= bash -c "$(curl -Lhttps://raw.githubusercontent.com/DataDog/dd-agent/master/packaging/datadog-
agent/source/install_agent.sh)"
You can obtain your API key when you register for a new account.

DataDog Agent is running and functioning properly after this command is done executing. It will continue to run in the background and submit metrics to Datadog.
If you ever want to stop the Agent, run:
sudo /etc/init.d/datadog-agent stopAnd to run it again run:
sudo /etc/init.d/datadog-agent startAdding new Monitor
To add a new Monitor, let's use the dashboard list we are provided:

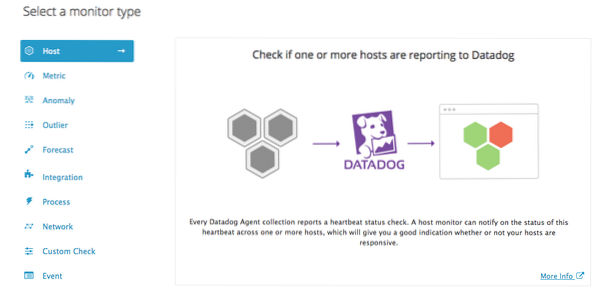
Creating a Host Monitor
To start, we create a most basic Monitor, a Host monitor. This monitor will check if the represented host is up or not.
Go on 'Create Monitor' and check Host:
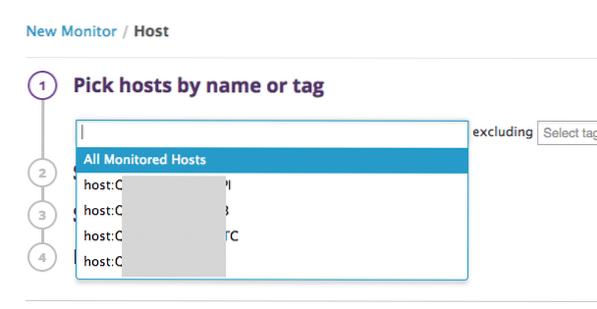
When you do this, you will be asked to pick a host from a list:
Finally, set an alert and notify the team:
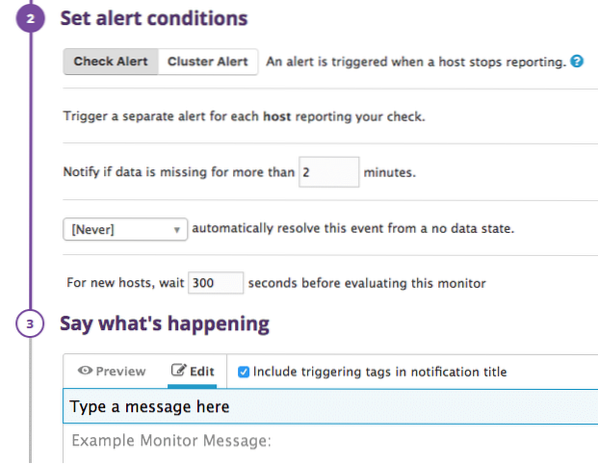
In above settings, it asks us about how many seconds to wait before an alert was generated. So easy to create a host alert!
RAM usage monitor
DataDog can, in near real-time, track how much RAM is used on your system and how much is free. If it crosses a threshold, it can create an alert.
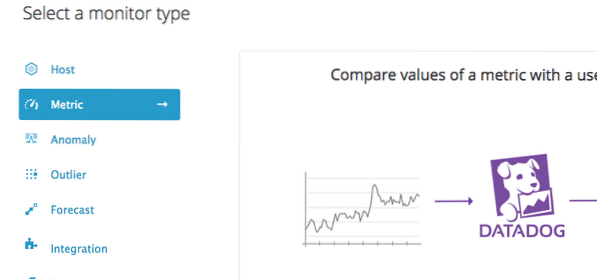
Go on and create a 'Metric' alert this time:
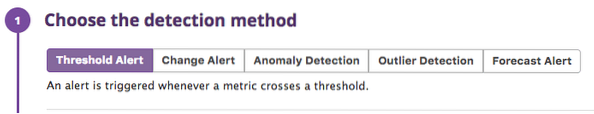
Now, we need to decide what kind of alert to generate, in our case, which will be a Threshold Alert.
Define the metric as system.mem.pct_usable which tracks the percentage of the RAM used till now:
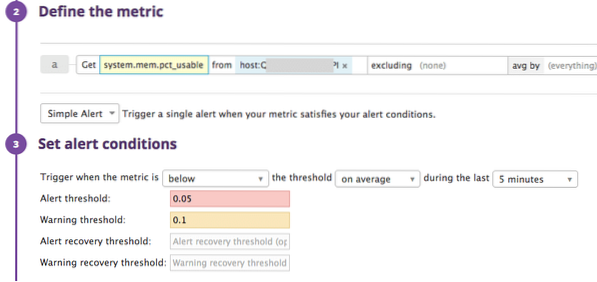
Add your host and describe the monitor.
In above settings, we describe that an alert should be generated when the available RAM is below 5% (0.05).
Again, a warning will be generated when the available RAM is below 10% (0.1).
Conditioning the Message
We can modify the message which is sent as an alert based on if the alert was an actual alert or a warning or when the alert is recovered. Let's demonstrate it here:
#is_alert Free RAM is below 5% ! /is_alert#is_warning Free RAM is at warning levels ! /is_warning
#is_recovery Free RAM looks good now ! /is_recovery
See, appropriate messages will be posted in appropriate conditions.
CPU usage monitor
DataDog can, in near real-time, also track how much CPU is used on your system and how much is free. If it crosses a threshold, it can create an alert.
Go on and create a 'Metric' alert again.

Notice in this case, we used system.cpu.user flag.
In above settings, we describe that an alert should be generated when the used CPU is above 90% (0.05).
Again, a warning will be generated when the used CPU is above 80% (0.1).
Process monitor
Finally, we will create a process monitor which tracks if a particular process is running on the machine or not. This process can be utterly helpful like:
- If you've Nginx running and you want to know it keeps running
- You run your web application and its process is not killed due to some other interferences
There are also some downsides for this monitor. Many times, a process internally doesn't work due to its own exceptions but it isn't killed by the system. In this case, DataDog will not report it as an alert.
Let's start creating a process monitor.
SSH into your Ubuntu machine and change your path where DataDog stores config files. By default it is:
cd /etc/dd-agent/conf.dIn this directory, there will be a many number of example config files. We will use process.yaml.example, copy it and just rename the duplicate file to process.yaml which we can modify.
In the file, enter the following content:
init_config:instances:
- name: my-process
Search_string: ['my-process-string']
exact_match: False
tags:
- env:dev
Let us see what is put in this file:
- We provide a name to our process which will show up in the DataDog dashboard
- Search_string is the string which appears when you search for a process on your machine. Note that you need to select a nice string which is unique to your process
- Setting exact_match to False is important so that this string is only searched and is not made to exactly match the found process
- Tag is just some metadata through which we can search for processes in our dashboard
Once you're done making this file, go on and restart the DD agent by using the command we provided above.
In our dashboard, create a new 'Process' monitor:
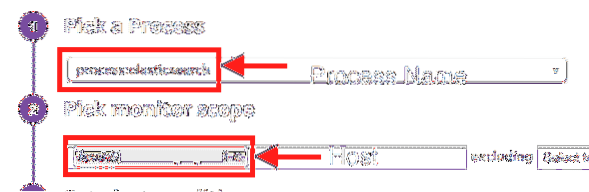
The process name we wrote in the file will appear here.
Now, we can decide some more settings:
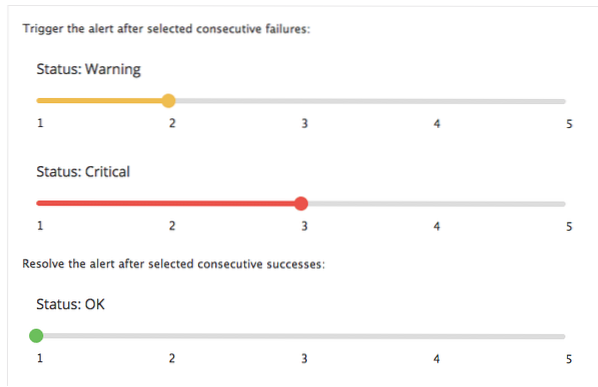
Finally, hit 'Save' and we're done.
With this you can see how we use DataDog for basic monitoring. If you have any questions or comments chat with us on twitter at @linuxhint.